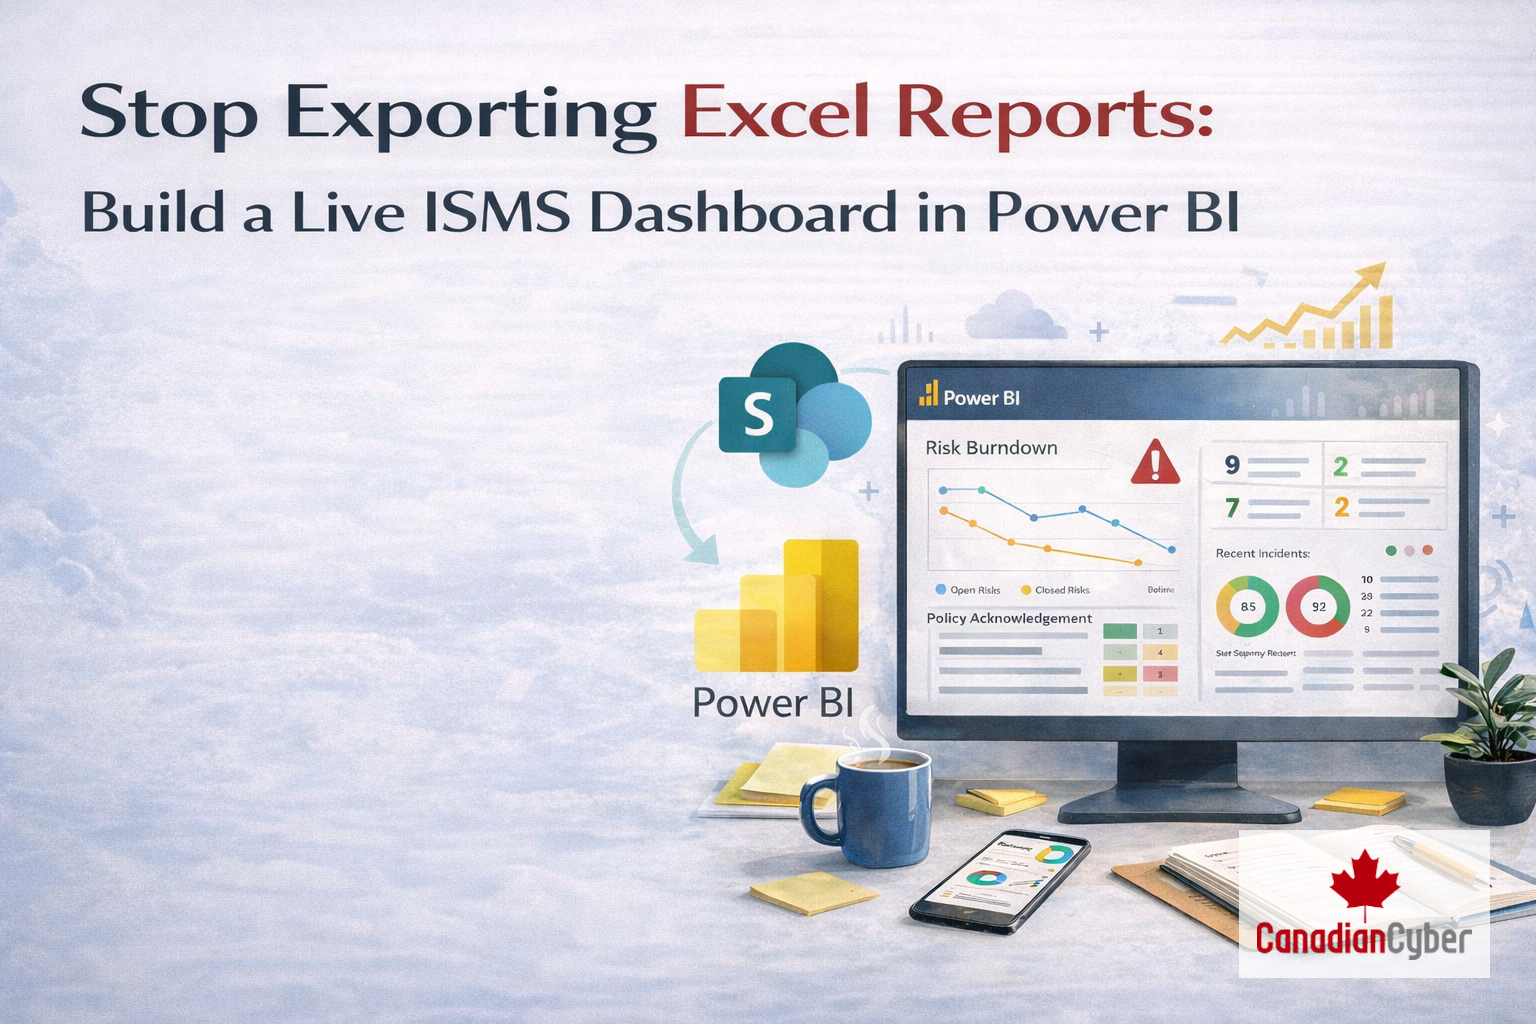
Stop Exporting Excel Reports
Build a Live ISMS Dashboard in Power BI (No Consulting Degree Required)
Your SharePoint lists already store every compliance KPI you need. Here’s how to connect them to Power BI and finally answer “Are we compliant?” in five seconds.
The CEO asks: “Are we audit-ready?”
You say: “I think so. Let me check a few things.”
That pause that tiny hesitation is where credibility goes to die.
You already have the data: risk registers, training completion, policy acknowledgements, vendor assessments.
It’s sitting in SharePoint lists, updated daily and maintained weekly.
But it’s invisible.
So every month you export to Excel, colour-code cells, build pivots, paste charts into slides and by the time it’s ready, the data is already old.
There’s a better way. You already own it.
The Problem: Data Rich, Insight Poor
Most ISMS programs suffer from the same paradox: you have more compliance data than ever, and less visibility than ever.
Not because you’re missing tools because the data is trapped inside the tools designed to collect it.
- Open risks sit in a list but no one sees the trend.
- Overdue training is scattered across systems and trackers.
- Policy acknowledgements hide in document history.
- Control failures live in spreadsheets and meeting notes.
None of this answers the only question that matters:
“Are we getting better or worse?”
The Solution: The ISMS Health Dashboard
A compliance dashboard isn’t a luxury. It’s the central nervous system of an effective ISMS.
It takes the pulse daily and flags issues before they become audit findings.
You don’t need a six-figure GRC tool to build one.
You already have the data infrastructure.
And if you’re running our ISMS SharePoint Platform, the data model is already designed for this.
What a High-Impact ISMS Dashboard Should Measure
Executive dashboards are not data dumps. They’re answer engines.
Build views that drive decisions fast.
| KPI Category | The Question | Data Source |
|---|---|---|
| Risk Posture | Are we adding risks faster than we remediate them? | Risk Register (SharePoint List) |
| Control Health | Which controls failed the last test cycle? | Control Testing Log (SharePoint List) |
| Policy Compliance | Who hasn’t acknowledged critical policies? | Policy Library (SharePoint + metadata) |
| Training Completion | Is our team audit-ready? | Training Records (SharePoint List) |
| Incident Velocity | Are incidents trending up or down? | Incident Register (SharePoint List) |
Notice the pattern? Every KPI originates in SharePoint.
Your ISMS is already producing the data. It just isn’t visualizing it.
Step 1: Clean Your Data at the Source
Here’s where most Power BI projects fail: teams try to clean messy data inside Power BI.
That’s like mopping the floor while the faucet is still running.
If your SharePoint lists have inconsistent entries, missing fields, or free-text chaos, the dashboard will reflect it.
- Use choice fields (Critical/High/Medium/Low) instead of free text.
- Use required fields for owners and dates.
- Use calculated fields for “Days Open” and “Next Review.”
Clean data at rest. Beautiful dashboards in minutes.
Step 2: Connect SharePoint to Power BI (It’s Native)
You don’t need middleware. You don’t need a developer.
The path is simple:
SharePoint List → Power BI → Dashboard
- Open Power BI Desktop
- Get Data → SharePoint Online List
- Paste your SharePoint site URL
- Select the lists (Risks, Training, Incidents, Testing)
- Transform Data (only if needed)
Permissions stay intact. If someone can’t see the list, they can’t see the dashboard.
No extra access drama.
Pro tip: use the SharePoint List connector (not the folder connector). Lists preserve your schema.
Step 3: Build Visuals That Answer Questions
The best visuals don’t just show numbers. They answer a question in one glance.
Here are three high-impact views.
View 1: Risk Burndown (Open vs. Closed)
Question: Are we winning or losing against risk?
Visual: stacked bar chart by month (Open Risks vs. Closed Risks).
If new risks consistently exceed closed risks, your risk posture is deteriorating. If closures rise but open stays flat, your remediation velocity is too slow.
View 2: Policy Acknowledgement Heatmap
Question: Which policies are being ignored?
Visual: matrix (Departments × Policies) with colour scale by % acknowledged.
Low acknowledgement on Incident Response isn’t just a training issue. It’s an audit and legal risk.
View 3: Control Testing Pass/Fail by Domain
Question: Where is our control environment weak?
Visual: pass rate by domain (Access Control, Change, Vendor, etc.).
Repeated failures in Access Control point to broken identity processes. Repeated Vendor failures point to procurement gaps.
Step 4: Publish and Set Refresh
- Publish to Power BI Service
- Set scheduled refresh (daily or hourly)
- Embed in Teams or SharePoint
Now when leadership asks “Are we audit-ready?” you don’t say “I think so.”
You open the dashboard and show the truth live.
Want a live ISMS dashboard fast without trial-and-error?
We’ll help you connect SharePoint to Power BI and build a board-ready view.
The Advanced Move: Alerts That Catch Problems Early
Once the dashboard is live, make it proactive. Use Power BI thresholds and Power Automate actions.
Two simple examples:
- Risk Threshold Alert
If 5+ High/Critical risks appear in 24 hours, notify the risk owner with the list. - Policy Acknowledgement Reminder
If acknowledgement drops below 80% before an audit, message non-compliant users with the policy link.
The Hidden Cost of “We’ll Build It Later”
- You lose trust when numbers conflict.
- You lose time formatting instead of fixing risks.
- You lose money when trends become audit findings.
The dashboard isn’t “nice to have.” It’s how you prove the ISMS is working.
Why This Works Better With Our ISMS SharePoint Platform
You can build Power BI on any SharePoint list. But if the lists are messy, the dashboard will be messy.
Our platform gives you a data model designed for executive reporting.
| Feature | Why It Matters for Power BI |
|---|---|
| Controlled choice columns | No typos. No “High/Risk/H” inconsistencies. |
| Calculated date fields | “Days Open” is ready. No complex DAX needed. |
| Lookup columns to SoA | Roll up control results to domains automatically. |
| Version history + acknowledgements | Track acknowledgement rates by policy version. |
| Pre-built views | Archived risks and inactive users are already filtered out. |
The 15-Minute Challenge
Book 15 minutes with our team. We’ll connect Power BI to your ISMS SharePoint lists (or our demo) and build a live dashboard in real time.
No cost. No commitment. Just proof. You’ll never email an Excel attachment again.
Ready to Turn On the Lights?
Most organizations wait months to get visibility. Our clients have dashboards in week one because the structure is already there.
Stay Connected With Canadian Cyber
Follow us for ISMS automation, compliance strategy, and practical security leadership insights:


