Rafia Rizwan

April 15, 2026
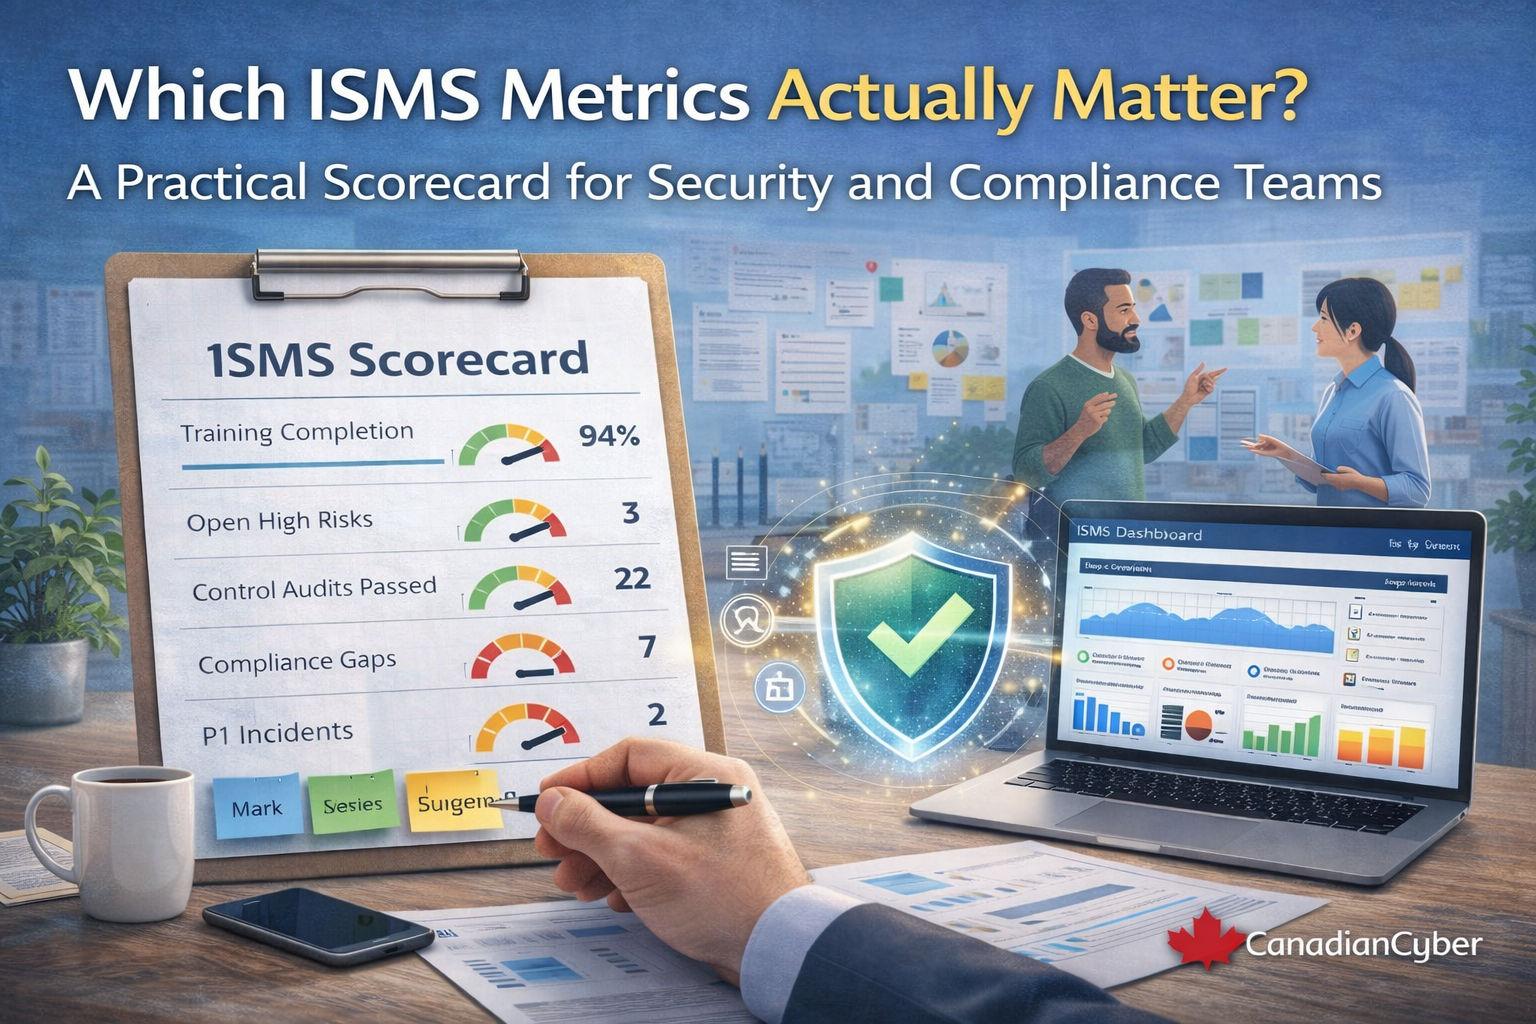
A practical guide to ISMS metrics that matter, helping security and compliance teams build a scorecard for risk, controls, and audit readiness.
Security and compliance teams often track training completion, audit findings, risk items, vendor reviews, access checks, patching status, policy reviews, and dozens of other data points across dashboards, spreadsheets, and ticketing tools.
But when leadership wants a clear view of risk, performance, accountability, and readiness, many of those numbers do not help much. That is because a lot of reporting still measures activity rather than effectiveness.
A practical ISMS scorecard should not try to track everything. It should help people see what matters, what is slipping, and what requires action.
On paper, most organizations already have plenty of data. What they often do not have is a practical scorecard that supports management decisions.
A useful ISMS scorecard should help your organization answer a small number of management questions clearly.
That is what leadership, auditors, and security teams actually need to see.
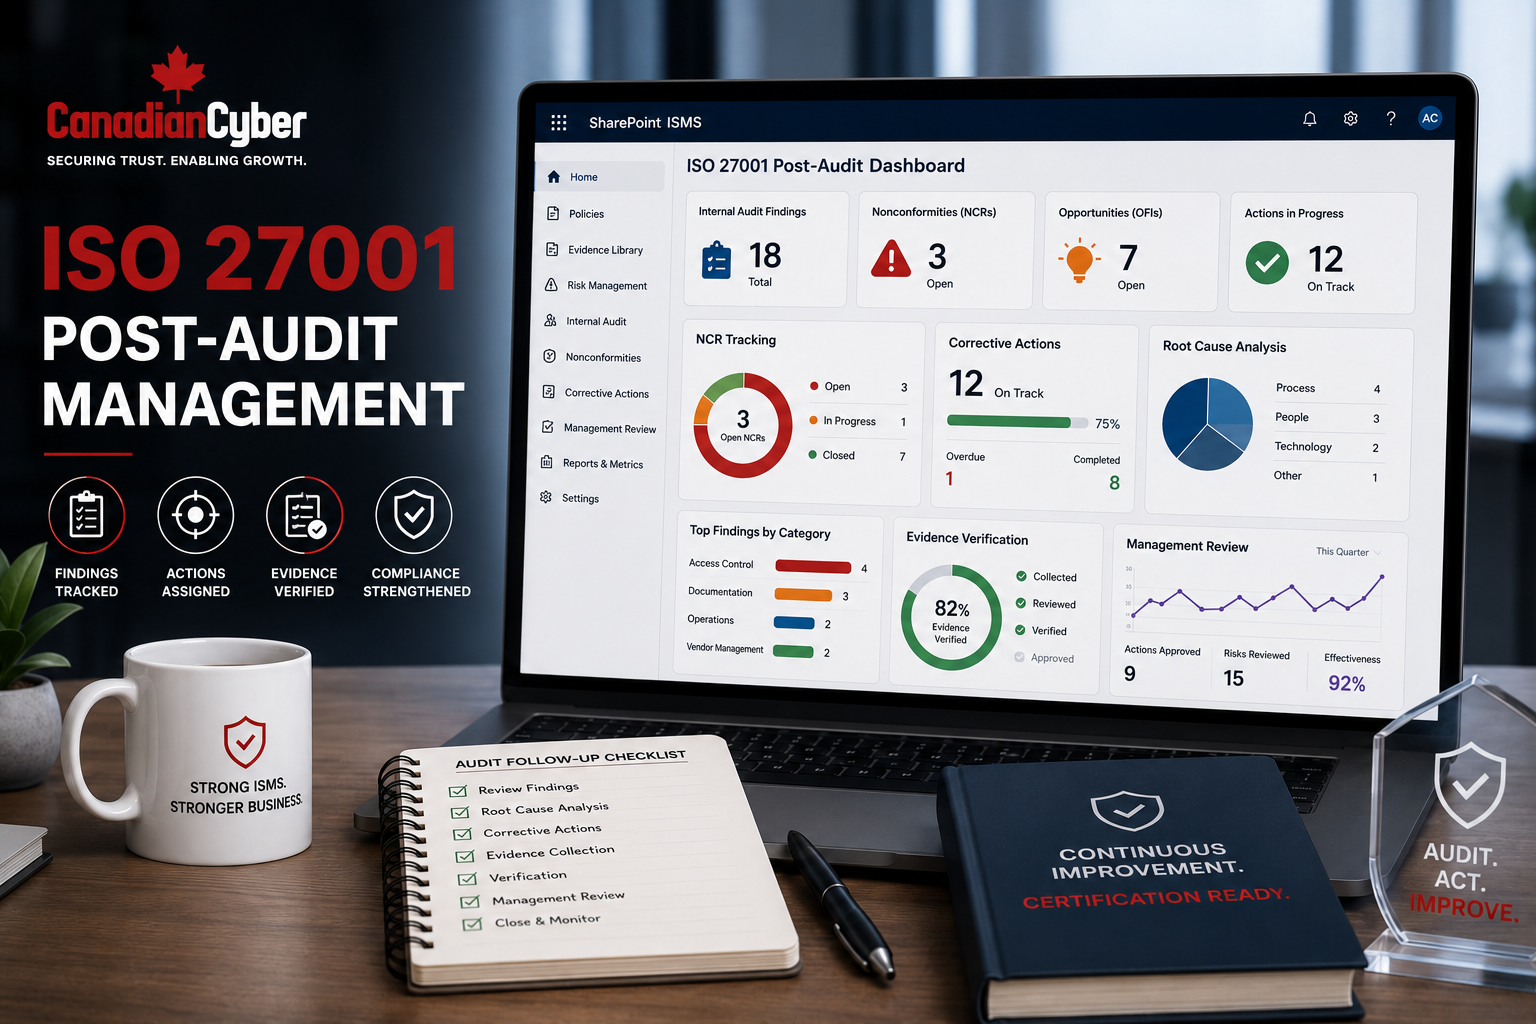
A compliance manager presents a monthly update with 100% training completion, 14 policies reviewed, 27 vendor assessments completed, 96% patching coverage, and 11 internal audits scheduled.
It sounds impressive, until leadership asks a different set of questions.
A practical ISMS scorecard usually works best when it is organized into a small set of categories that reflect real program health.
Risk metrics should show whether your ISMS reflects the organization’s actual exposure, not just whether a risk register exists.
| Metric | Why it matters |
|---|---|
| Total open risks | Shows overall risk workload. |
| High-risk items open | Highlights serious unresolved exposure. |
| Risks past review date | Shows whether the register is being maintained. |
| Risks without treatment plans | Identifies weak follow-through. |
| Repeat risks | Signals unresolved root causes. |
A strong scorecard does not just count risks. It shows whether risks are being reviewed, treated, and managed properly.
Many organizations report that controls are implemented. That does not automatically mean they are healthy.
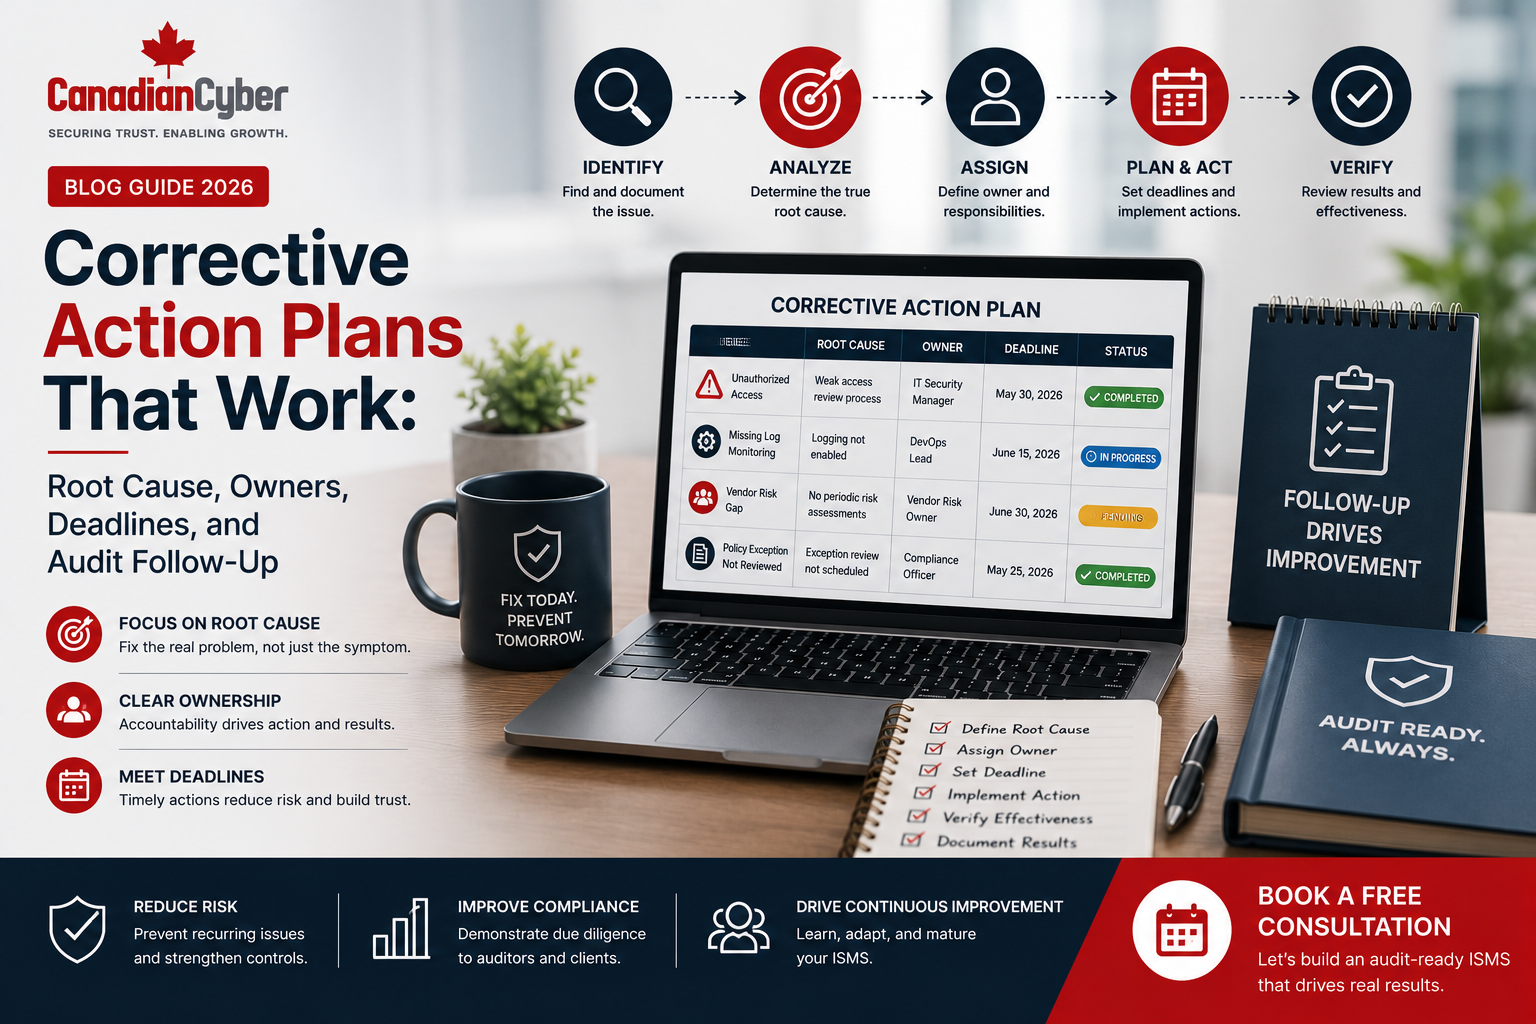
Corrective action tracking is one of the clearest indicators of ISMS maturity because it shows whether the organization follows through after issues are identified.
| Metric | Why it matters |
|---|---|
| Total open corrective actions | Shows remediation workload. |
| Overdue corrective actions | Highlights execution risk and weak follow-through. |
| High-priority actions open | Keeps focus on material issues. |
| Average days to close | Shows response efficiency over time. |
| Actions awaiting verification | Prevents premature closure. |
| Repeat findings | Indicates weak remediation or shallow root cause analysis. |
These metrics tell a much stronger story than simply reporting how many findings were raised.
Audit metrics should not just show what was completed. They should show where the program is exposed and where governance is drifting.
Incident metrics should help you understand resilience, not just event volume.
The goal is not perfect numbers. The goal is to spot trends, bottlenecks, and recurring weaknesses before they become larger issues.
Access issues appear repeatedly in audits and incidents, which makes them high-value measures for any ISMS scorecard.
| Metric | Why it matters |
|---|---|
| Quarterly access reviews completed | Confirms governance activity is operating on schedule. |
| Orphaned accounts identified | Highlights lifecycle weaknesses. |
| MFA coverage for critical systems | Measures real control coverage. |
| Privileged accounts without review | Signals elevated access risk. |
| Access exceptions overdue | Shows weak exception handling. |
Third-party risk matters heavily for ISO 27001, SOC 2, customer trust, and enterprise due diligence, yet it is often measured inconsistently.
Training completion on its own is rarely enough. Completion percentages can look strong while risky behavior continues underneath the surface.
This is what turns awareness from a checkbox into accountability.
A useful scorecard is usually short enough to review monthly and clear enough for leadership to understand quickly. It should not try to impress with volume.
Many teams improve leadership reporting by using a simple Red, Amber, Green model instead of long narrative explanations.
| Area | Green | Amber | Red |
|---|---|---|---|
| Corrective Actions | Few overdue items | Some overdue items | Many overdue high-risk items |
| Risk Register | Current and reviewed | Some items outdated | High-risk items stale or untreated |
| Access Reviews | Completed on time | Slight delay | Critical reviews missed |
| Policies | Reviews on schedule | A few overdue | Several key policies overdue |
| Vendors | Critical vendors reviewed | Some reassessments pending | High-risk vendors unreviewed |
Not every number deserves space on the main scorecard. Some numbers are operationally useful, but weak for management review.
These numbers may exist in the background, but they should not dominate the scorecard.
The best ISMS metrics are not the ones that make the dashboard look full. They are the ones that tell you where risk is building, where controls are weakening, where remediation is stalling, where governance is slipping, and whether the program is actually improving.
A practical ISMS scorecard should be clean, focused, and useful enough that both leadership and security teams can act on it.
Because in the end, the purpose of ISMS metrics is not to collect numbers. It is to drive better decisions.